The Hazard-Ratio Autopsy: When Delayed Effects Make One Number Misleading
Anas H. Alzahrani, MD PhD MPH
Department of Preventive Medicine and Public Health
Faculty of Medicine, King Abdulaziz University
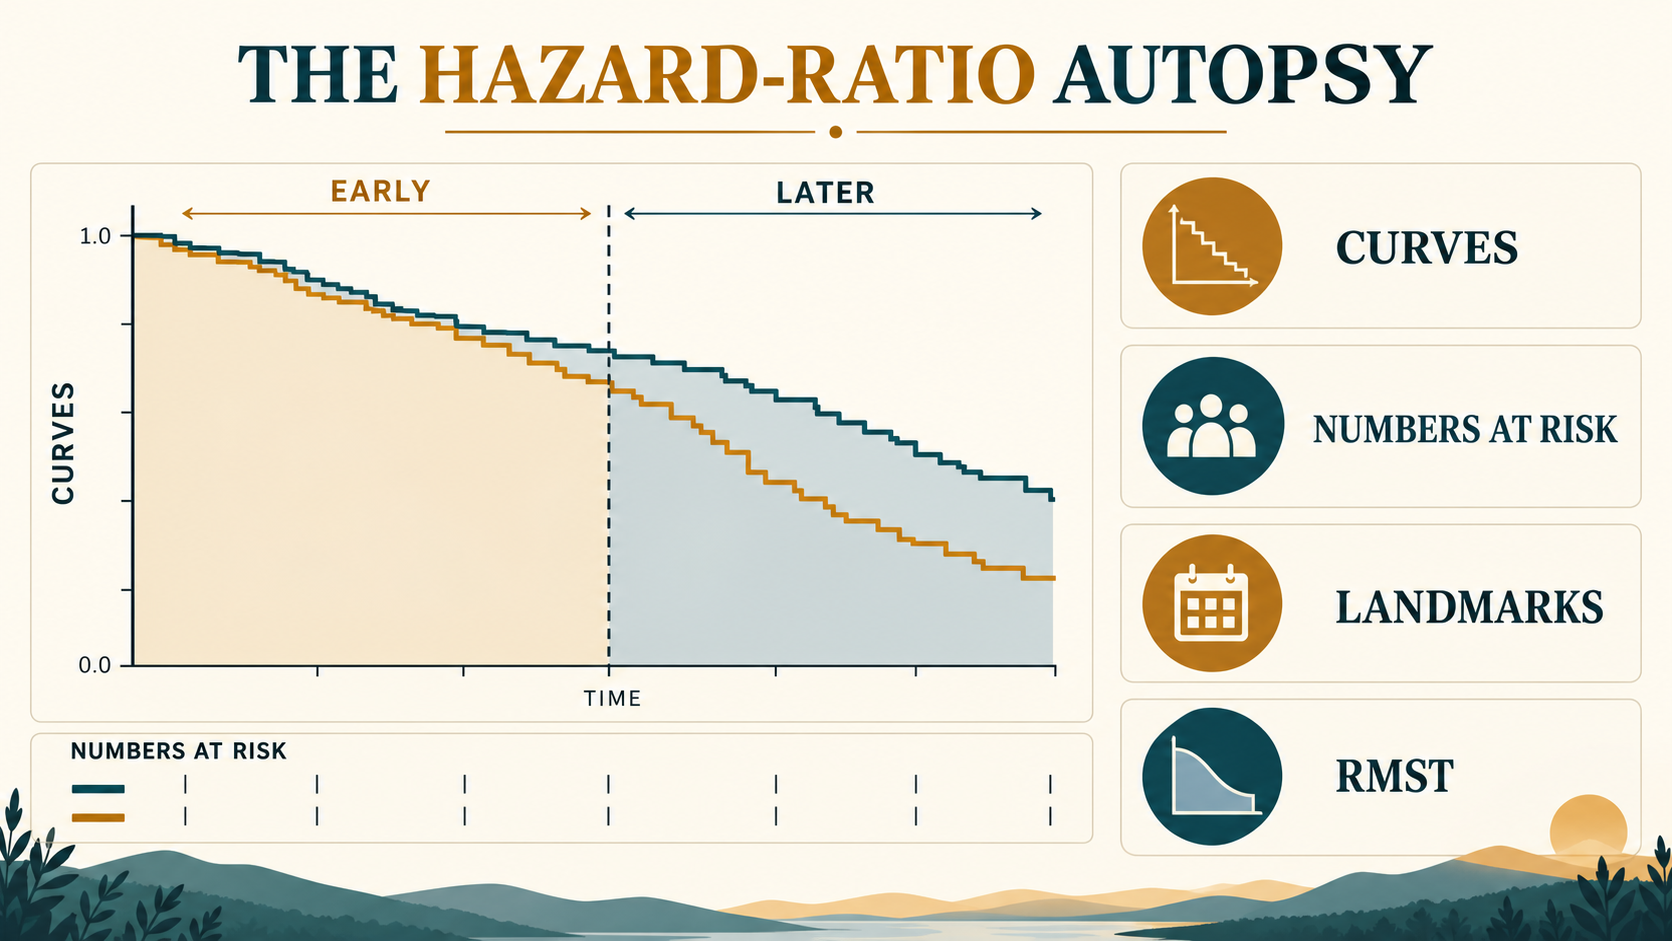
A survival trial reports a hazard ratio below 1. The abstract translates it into a constant percentage reduction in risk. But the curves overlap early and separate later. The summary number may be valid for the prespecified test while the constant-effect sentence is not.
This is the central lesson of non-proportional hazards: a hazard ratio can compress a changing treatment effect into one average relative comparison. To understand the patient experience, reconstruct the curve, the risk sets, and the time horizon—not only the headline ratio.
The Estimand in One Sentence
The hazard ratio compares instantaneous event rates among participants still event-free at each time, then summarizes those comparisons over follow-up; it is not a direct probability, an absolute risk difference, or a guarantee that the relative effect is constant.
Concrete takeaway
If the survival curves change their relationship over time, replace “the treatment reduces risk by X% throughout follow-up” with a time-aware description supported by absolute survival, prespecified landmarks, or restricted mean survival time.
Why Delayed Effects Break the Shortcut
The familiar percentage interpretation of a hazard ratio relies on a proportional-hazards story: the ratio between treatment and comparator hazards is reasonably stable over time. Immunotherapies, delayed treatment onset, treatment switching, early toxicity, and depletion of susceptible patients can all produce effects that vary with time. A Cox model may still yield a useful weighted summary, but the clinical meaning depends on when the curves differ and who remains under observation.
Crossing or delayed-separation curves do not automatically invalidate a trial. They do invalidate lazy narration. The reviewer should ask whether the primary test was prespecified and appropriate, then separate evidence of any treatment difference from characterization of its timing and magnitude.
Case Study: CheckMate 057
CheckMate 057 randomized 582 patients with previously treated advanced nonsquamous non-small-cell lung cancer to nivolumab or docetaxel. Overall survival favored nivolumab: median survival was 12.2 versus 9.4 months, with a hazard ratio for death of 0.73 (96% confidence interval 0.59 to 0.89). One-year survival was 51% versus 39%.
Progression-free survival told a more time-dependent story. Median progression-free survival was shorter with nivolumab—2.3 versus 4.2 months—yet one-year progression-free survival was higher, 19% versus 8%. The paper's Kaplan–Meier display shows why a median alone can miss a durable later tail. The correct lesson is not “ignore the median” or “the hazard ratio is wrong.” It is that different summaries answer different questions.
The response rate was 19% versus 12%, and grade 3 or 4 treatment-related adverse events occurred in 10% versus 54%. These results distinguish antitumor activity, survival benefit, and tolerability. None should be collapsed into a single efficacy statistic.
Nine Evidence Lanes That Must Stay Separate
| Lane | What this case supports | Maturity |
|---|---|---|
| Biological activity | Responses and a later PFS tail support antitumor activity, not uniform early benefit. | Completed phase III trial |
| Patient benefit | Overall survival and severe-toxicity results support a patient-relevant benefit–risk assessment. | Completed phase III trial |
| Regulatory sufficiency | A prespecified primary test can support a regulatory conclusion; significance alone does not fully describe benefit. | Official framework |
| Market relevance | Not inferable from these efficacy results without indication-specific uptake and competition evidence. | Not assessed |
| Multiplicity | Landmarks, RMST horizons, weighted tests, and subgroups should not be selected after viewing the curves. | Established principle |
| Safety | Severe treatment-related events favored nivolumab; timing and immune-mediated harms still require inspection. | Completed phase III trial |
| Catalysts | No current issuer catalyst is asserted in this historical methods case. | Not assessed |
| Cash runway | Cannot be inferred from a clinical-trial result. | Not assessed |
| Dilution | Requires current filings and financing needs. | Not assessed |
What RMST Adds
Restricted mean survival time is the area under a survival curve from time zero to a prespecified horizon. The between-group contrast is expressed in time—such as additional event-free or survival time accumulated by that horizon. It does not require proportional hazards and can make a changing effect easier to explain.
RMST is not a rescue statistic to choose after inspecting an inconvenient curve. The horizon must be clinically meaningful, supported by follow-up in both groups, and preferably prespecified. Selecting the most favorable cutoff creates the same multiplicity problem as searching among endpoints or subgroups.
The 90-Second Hazard-Ratio Audit
- Do the Kaplan–Meier curves suggest a roughly stable relative effect over time?
- How many participants remain at risk when the curves begin to separate?
- Were landmarks and the RMST horizon chosen before outcomes were examined?
- Are absolute survival probabilities and confidence intervals reported at useful times?
- Could treatment switching, informative censoring, or assessment timing explain the pattern?
- Does the conclusion describe the studied population, follow-up, and time-varying effect?
Sources and Evidence Maturity
- Borghaei et al., Nivolumab versus Docetaxel in Advanced Nonsquamous Non-Small-Cell Lung Cancer (22 October 2015) — completed randomized phase III trial; primary source for the CheckMate 057 efficacy and safety results.
- Royston and Parmar, Restricted Mean Survival Time: An Alternative to the Hazard Ratio (7 December 2013) — peer-reviewed methods paper; established foundation for RMST design and analysis.
- FDA Oncology Center of Excellence, Project SignifiCanT: Statistics in Cancer Trials (content current 27 July 2026) — current official program for oncology-trial statistical design and analysis.
- ICH E9(R1), Addendum on Estimands and Sensitivity Analysis in Clinical Trials (3 December 2019) — Step 4 harmonized guideline; mature regulatory framework for explicit treatment-effect questions and sensitivity analysis.
Evidence note: this is a methods autopsy of a historical trial, not treatment advice or a current investment analysis. Market relevance, catalysts, cash runway, and dilution were deliberately left unassessed.
Where Aqrab Fits
Aqrab can help reviewers extract the prespecified estimand, primary test, censoring rules, curve landmarks, numbers at risk, and sensitivity analyses from a trial report and protocol. Use the output as a structured review aid—not a substitute for the statistician, the Kaplan–Meier display, or the source documents. Try Aqrab on a survival-analysis paper, or explore plans for repeatable evidence-review workflows.
Keep reading
Don't stop at one method.
Good methods judgment comes from contrast. Read the neighboring guides, see where the assumptions diverge, and avoid treating every observational problem like it needs the same hammer.
Recurrent Events in Clinical Trials: When Time to First Event Hides Disease Burden
A practical guide to recurrent-event analysis in clinical trials. Learn when time to first event discards patient burden, how death changes the estimand, and what reviewers should demand.
Multi-State Models: When One Time-to-Event Endpoint Hides the Clinical Path
A practical multi-state models guide for clinical researchers. Learn how state occupation, transition hazards, and time in state reveal clinical paths hidden by one survival endpoint.
Nonproportional Hazards: When One Hazard Ratio Pretends the Treatment Effect Never Changes
A practical guide to nonproportional hazards for clinical researchers. Covers delayed effects, crossing curves, waning benefit, why one hazard ratio can mislead, and what reviewers should demand instead.
This is the newest guide so far.