Prediction Intervals in Meta-analysis: The Average Is Not Your Next Setting
October 11, 2026 · 7 min read · Aqrab editorial team
A meta-analysis reports a precise average benefit. The next clinic, however, is not the average study. When true effects differ across studies, a narrow confidence interval around their pooled mean can coexist with a much wider range of plausible effects in a similar new setting. Reading those as the same interval makes a transportability question disappear.
Two Intervals, Two Questions
In a random-effects meta-analysis, the confidence interval for the pooled mean describes uncertainty about the average of a distribution of underlying study effects. It does not show how far those effects vary. The prediction interval uses estimated between-study variation as well as uncertainty in the mean to indicate a range for an underlying effect in a new study similar to those synthesized. Cochrane also recommends reading it as a summary of the spread of underlying effects in the included studies.
Neither interval predicts an individual patient's treatment response. A prediction interval concerns a study-level effect under a model and an assumption of relevant similarity; it is not a personalized-effect interval or a guarantee for a particular hospital.
A Worked Reading, Not a Re-analysis
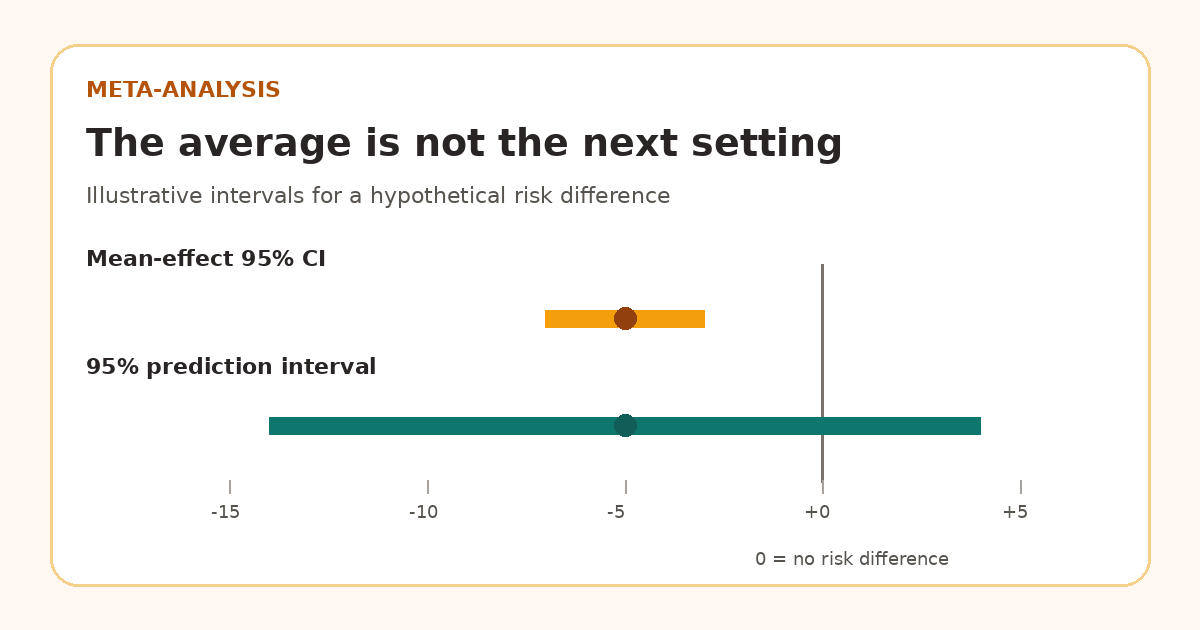
Imagine, solely for illustration, a pooled risk difference of −5 percentage points, with a 95% confidence interval for the mean of −7 to −3 points and a 95% prediction interval of −14 to +4 points. These intervals are stipulated teaching values; they were not calculated from a study set. The mean-effect interval excludes zero, but the prediction interval crosses it. That is not a contradiction. It says the average benefit could be estimated precisely while underlying effects in similar settings may vary enough to include little benefit or harm.
The headline correction
“The pooled mean suggests benefit” is different from “benefit is expected in every setting.” Report the mean and its interval, then examine the prediction interval and the reasons studies may differ.
Why the Interval Can Mislead
The prediction interval is only as credible as the studies and model behind it. Between-study variance is hard to estimate when there are few studies or few events. The usual calculation relies strongly on an assumed distribution of true effects; with sparse studies it can be spuriously narrow or wide. Cochrane encourages prediction intervals when a reasonable number of studies are available—for example, five or more—and there is no clear funnel-plot asymmetry, while emphasizing caution even then.
Variation can reflect genuine differences in populations, dose, comparators, follow-up, or outcomes. It can also reflect bias and inconsistent methods. A random-effects model does not clean away those problems. And a future hospital outside the populations represented in the review is not made exchangeable with them simply by calculating an interval.
Four Questions for a Forest Plot
- What is the target? Is the paper estimating an average across included settings or claiming relevance to a particular decision setting?
- How different are the studies? Inspect clinical and methodological diversity, study estimates, and the estimated between-study variance; do not reduce heterogeneity to a single threshold on I².
- How stable is the prediction interval? Check the study count, sparse events, variance-estimation method, and sensitivity to influential studies. A printed interval is not proof of precision.
- Does the new setting belong? Compare population, intervention, comparator, outcome definition, and follow-up before treating the prediction interval as locally applicable.
Where Aqrab Fits
Use Aqrab to pressure-test a review's leap from a pooled mean to a local clinical claim. A methods critique can flag missing heterogeneity context and unsupported transportability; it cannot supply a prediction interval when study-level inputs are unavailable.
Source Anchors and Evidence Maturity
Cochrane Handbook, Chapter 10 (last updated November 2024) is official methods guidance on random-effects interpretation, prediction intervals, and sparse-study limits. Riley, Higgins, and Deeks, BMJ (10 February 2011) is a peer-reviewed methods explanation of the pooled mean and prediction interval. Both support interpretation, not any numerical effect in the hypothetical example above.
Keep reading
Don't stop at one method.
Good methods judgment comes from contrast. Read the neighboring guides, see where the assumptions diverge, and avoid treating every observational problem like it needs the same hammer.
Standardized Mean Differences: When 0.4 SD Still Needs Clinical Units
A practical guide to standardized mean differences in meta-analysis. Learn why the denominator depends on the study population, why generic effect-size labels do not establish clinical importance, and how to back-translate an SMD without hiding the assumptions.
Estimands in Meta-Analysis: When a Shared PICO Still Pools Different Questions
A practical guide to estimands in meta-analysis. Learn how treatment-policy and hypothetical strategies can make trials with the same PICO answer different questions, and how to audit the pool before combining effects.
AI Literature Search: Why Plausible Citations Are Not Evidence Coverage
A practical guide to auditing AI literature search in clinical research. Separate valid citations from evidence coverage, measure retrieval recall, and demand a reproducible search trail.