Parametric G-Formula: Estimating Causal Effects When Covariates Change Over Time
📖 17 min read · Published Apr 19, 2026
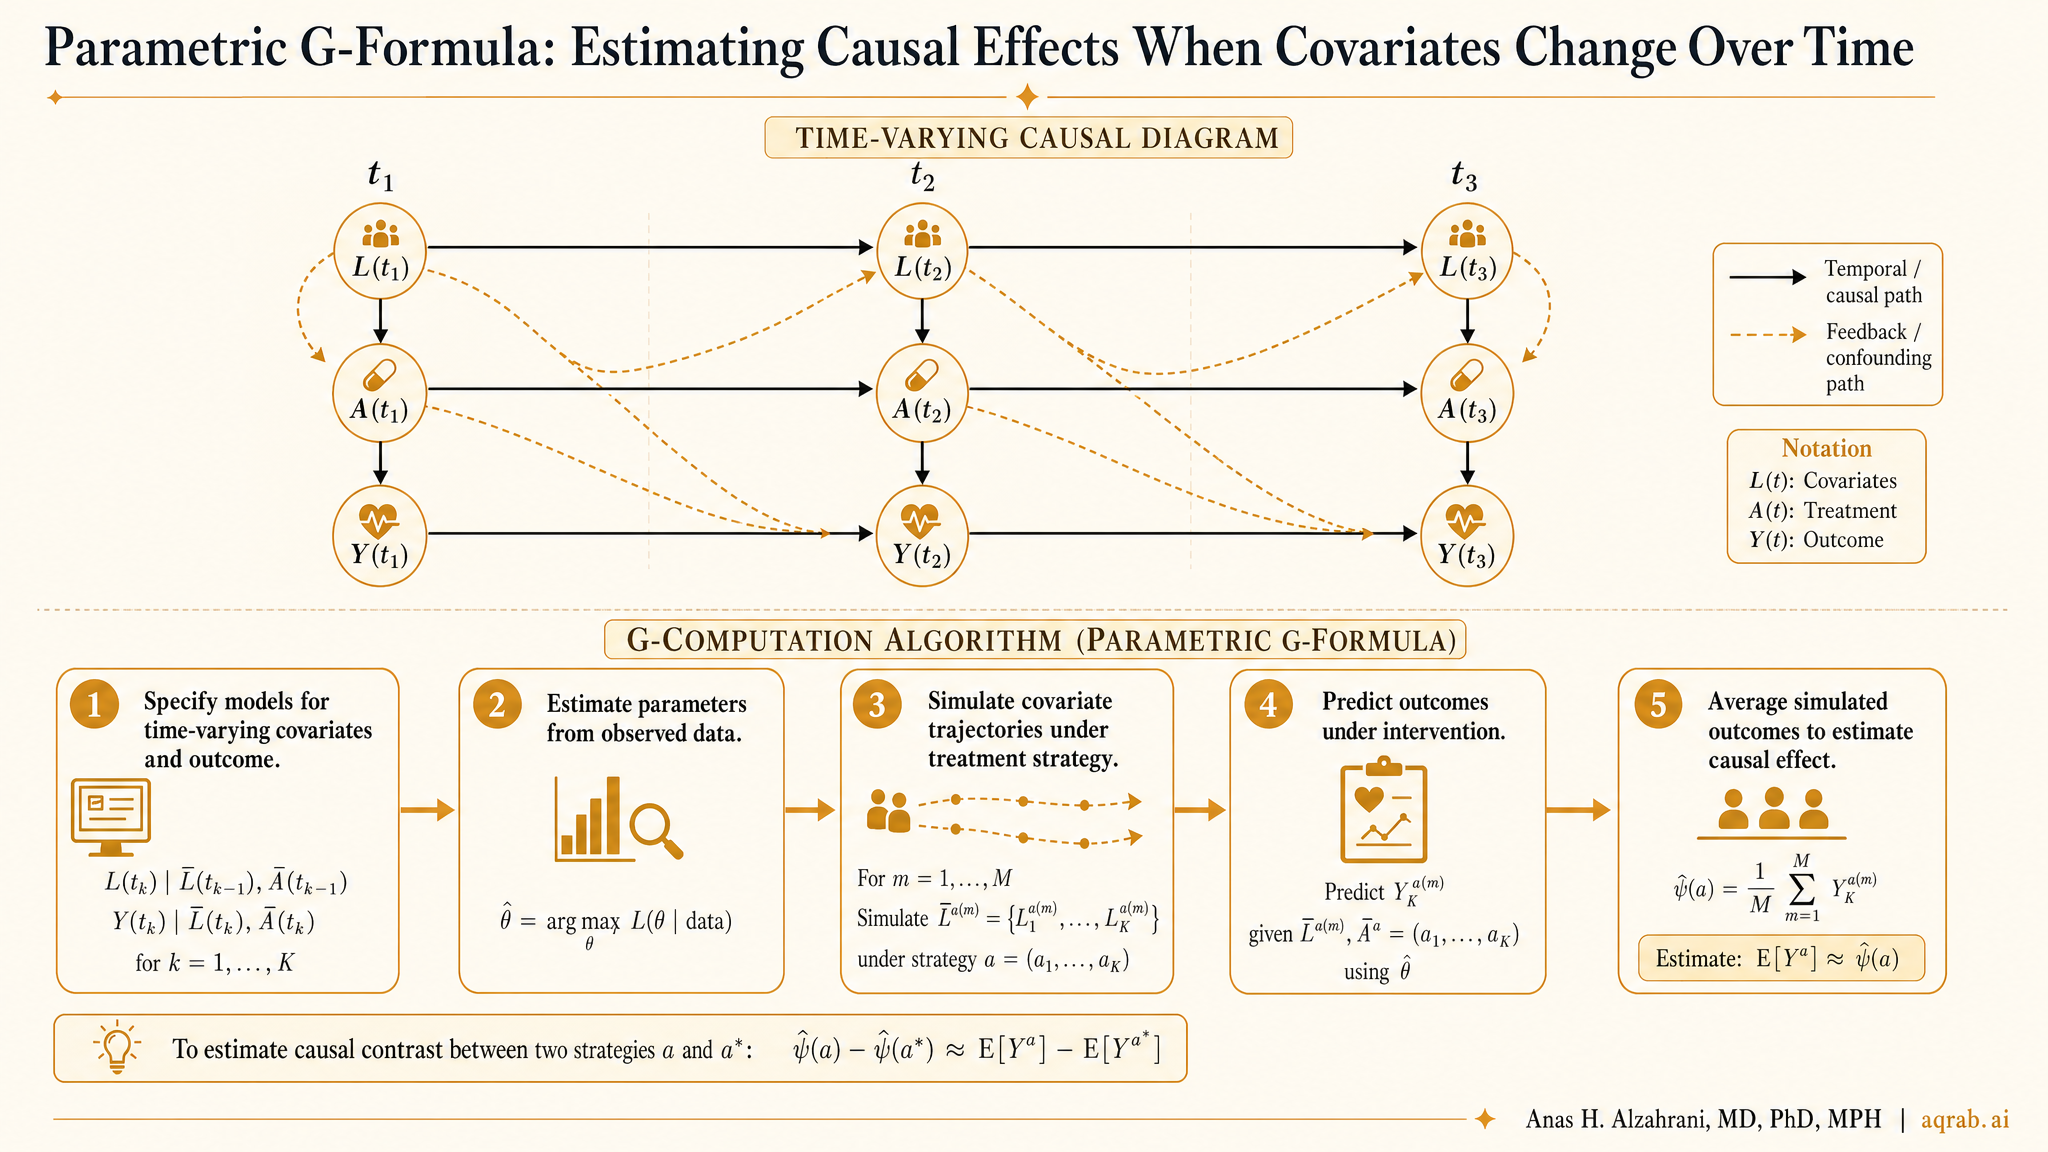
Longitudinal clinical data are full of variables that both predict future treatment and are themselves changed by earlier treatment. That is exactly where naive regression starts lying to you. The parametric g-formula exists for this mess. Instead of hoping one adjustment set fixes everything, it models how treatment, confounders, and outcomes evolve over time, then simulates what would happen under specific intervention strategies.
This is one of the most important tools in causal inference, and one of the least understood. People hear “g-formula” and either tune out because it sounds too mathematical or confuse it with just another weighted model. Both reactions miss the point. The g-formula is the logic sitting underneath causal standardization in longitudinal settings. It asks a simple question in a hard setting: if everyone followed treatment strategy A versus strategy B, what outcome distribution would we expect?
Why Standard Regression Breaks
Suppose you are studying corticosteroid use in critically ill patients. Daily oxygen requirement affects whether steroids are given tomorrow. But oxygen requirement is also affected by whether steroids were given yesterday. That makes it a time-varying confounder affected by prior treatment.
If you adjust for that evolving oxygen marker in an ordinary regression, you may block part of the treatment effect you actually want. If you do not adjust for it, you leave confounding in place. Congratulations, both obvious options can be wrong.
This is the core problem:
Longitudinal confounders can be both confounders and intermediates. Treating them like ordinary baseline covariates is causal self-sabotage.
What the G-Formula Actually Does
The parametric g-formula builds models for the joint evolution of the data over time: covariates, treatment, censoring, and outcome. Once those models are estimated, you simulate the population repeatedly under a hypothetical intervention strategy.
In plain English, you create a synthetic world where everyone follows a rule, then estimate what would happen in that world.
Observed world
Treatment decisions change over time based on evolving patient status, clinician judgment, and prior treatment response.
Intervention world
Everyone follows a specified strategy, for example “start treatment when oxygen need exceeds threshold X” or “never initiate treatment.”
Estimated causal contrast
The difference in risk, survival, or mean outcome between those simulated intervention worlds.
That is why the g-formula is so useful for dynamic treatment regimes. It does not just compare exposed versus unexposed. It lets you compare realistic clinical strategies over time.
A Clinical Example
Imagine an ICU cohort where you want to estimate the 28-day mortality effect of initiating vasopressors early versus delaying until a higher shock threshold is reached. Blood pressure, lactate, urine output, and clinician-assessed instability all change daily. Those variables influence treatment decisions and are influenced by prior treatment.
A baseline-adjusted Cox model will not handle that structure cleanly. The parametric g-formula can, at least in principle, simulate mortality under strategies like:
- Strategy 1: start vasopressors as soon as mean arterial pressure drops below a predefined threshold.
- Strategy 2: delay initiation until the threshold is substantially lower.
- Strategy 3: never initiate during the observed window.
Those are policy-like contrasts. That is the kind of question clinicians actually care about.
How the Workflow Usually Looks
- Define the target trial-like intervention strategies and estimand.
- Choose the time scale, such as days, clinic visits, or treatment cycles.
- Model time-varying covariates conditional on prior history.
- Model the outcome and often censoring conditional on prior history.
- Simulate many copies of the cohort under each intervention strategy.
- Average the simulated outcomes to estimate risks, means, or survival curves.
Under the hood, this is a sequence of conditional expectations. In practice, it is a full longitudinal data-generating model followed by Monte Carlo standardization.
Why It Is Different from MSMs
Marginal structural models and the parametric g-formula are cousins, not twins. MSMs usually rely on inverse probability weights to create a pseudo-population where treatment is unconfounded at each time point. The g-formula instead models the covariate process and outcome process directly, then standardizes over them.
Fast comparison:
If unstable weights are your nightmare, the g-formula can be attractive. If model misspecification across many longitudinal components is your nightmare, maybe not. Pick your pain honestly.
| Method | Main idea | Typical weakness |
|---|---|---|
| Parametric g-formula | Model the longitudinal data process, then simulate interventions | Heavy dependence on correct model specification |
| MSM / IPW | Weight to balance time-varying confounding across treatment histories | Extreme or unstable weights, positivity problems |
| G-estimation | Estimate structural nested models using treatment-free potential outcomes logic | Less intuitive and harder to communicate clinically |
The Assumptions You Still Need
1. Exchangeability
No unmeasured confounding conditional on the observed treatment and covariate history. The g-formula does not magically rescue missing severity data.
2. Positivity
For every relevant history, the intervention strategy must be supported by the data. If nobody like this patient ever followed the rule, your simulation is extrapolation wearing a lab coat.
3. Consistency
The intervention must be well-defined. “Usual care” is not a strategy. It is an excuse.
4. Correct model specification
This one is the killer. Because you model multiple longitudinal pieces, misspecification can compound fast.
Where People Mess It Up
❌ Vague intervention rules
If the treatment strategy could not be written into a protocol, it is not ready for a g-formula analysis.
❌ Pretending model complexity is optional
Longitudinal processes are rarely linear and clean. Oversimplified nuisance models will quietly poison the estimate.
❌ Ignoring censoring as if it were harmless
Loss to follow-up, discharge, treatment switching, and competing events can all distort the simulated world if not handled explicitly.
❌ No diagnostic reporting
If you never compare simulated data back to observed data, nobody should trust your longitudinal model.
What Good Reporting Looks Like
- State the target estimand clearly, including the intervention strategies compared.
- Describe time zero, follow-up intervals, censoring rules, and competing event handling.
- List the time-varying covariates and explain why they were included.
- Describe the models used for covariate evolution, treatment, outcome, and censoring.
- Show diagnostics comparing observed versus simulated trajectories or risks.
- Address positivity concerns and where the intervention relies on extrapolation.
- Include sensitivity analyses for model form and intervention definitions.
If a paper says “we used the parametric g-formula” and then gives you one sentence plus a software citation, that is not rigor. That is method laundering.
When the G-Formula Is a Strong Choice
- You have repeated measurements and real treatment-confounder feedback.
- You care about dynamic treatment strategies, not just static exposure categories.
- You can define interventions that resemble clinical policies.
- You have enough data support across treatment histories to avoid ridiculous extrapolation.
- You are willing to show diagnostics instead of hiding behind software defaults.
When It Is the Wrong Tool
- Your intervention is poorly defined or clinically incoherent.
- Your dataset barely measures key time-varying confounders.
- Your sample size cannot support flexible longitudinal modeling.
- Your positivity situation is a disaster and no one like half your intervention group exists in the other strategy.
- You mainly want a sophisticated-sounding method to decorate a weak retrospective design.
Hard truth:
The g-formula is not a cheat code. It rewards careful design and punishes lazy thinking harder than simpler methods do.
Bottom Line
The parametric g-formula is one of the clearest ways to estimate causal effects in longitudinal data with time-varying confounding affected by prior treatment. It shifts the question from “what coefficient came out of the regression?” to “what would happen if this intervention strategy were actually followed over time?”
That is exactly why it matters. It is closer to the clinical question. But it only earns that credibility if the intervention is well-defined, the longitudinal models are defensible, and the reporting is brutally transparent. Otherwise you are just simulating nonsense faster.