Restricted Mean Survival Time: When Hazard Ratios Are Not the Clinical Answer
Anas H. Alzahrani, MD PhD MPH
Department of Preventive Medicine and Public Health
Faculty of Medicine, King Abdulaziz University
GPT Image 2 visual generated for Anas H. Alzahrani, MD PhD MPH.
Survival papers love the hazard ratio because it is compact, familiar, and sounds serious. Unfortunately, it also answers a question many clinicians did not ask and many datasets do not support very gracefully.
Restricted mean survival time, or RMST, offers a cleaner alternative: instead of comparing instantaneous event rates under proportional hazards assumptions, it compares the average event-free time accumulated up to a chosen horizon. That is often much closer to what people actually want to know.
What RMST Actually Is
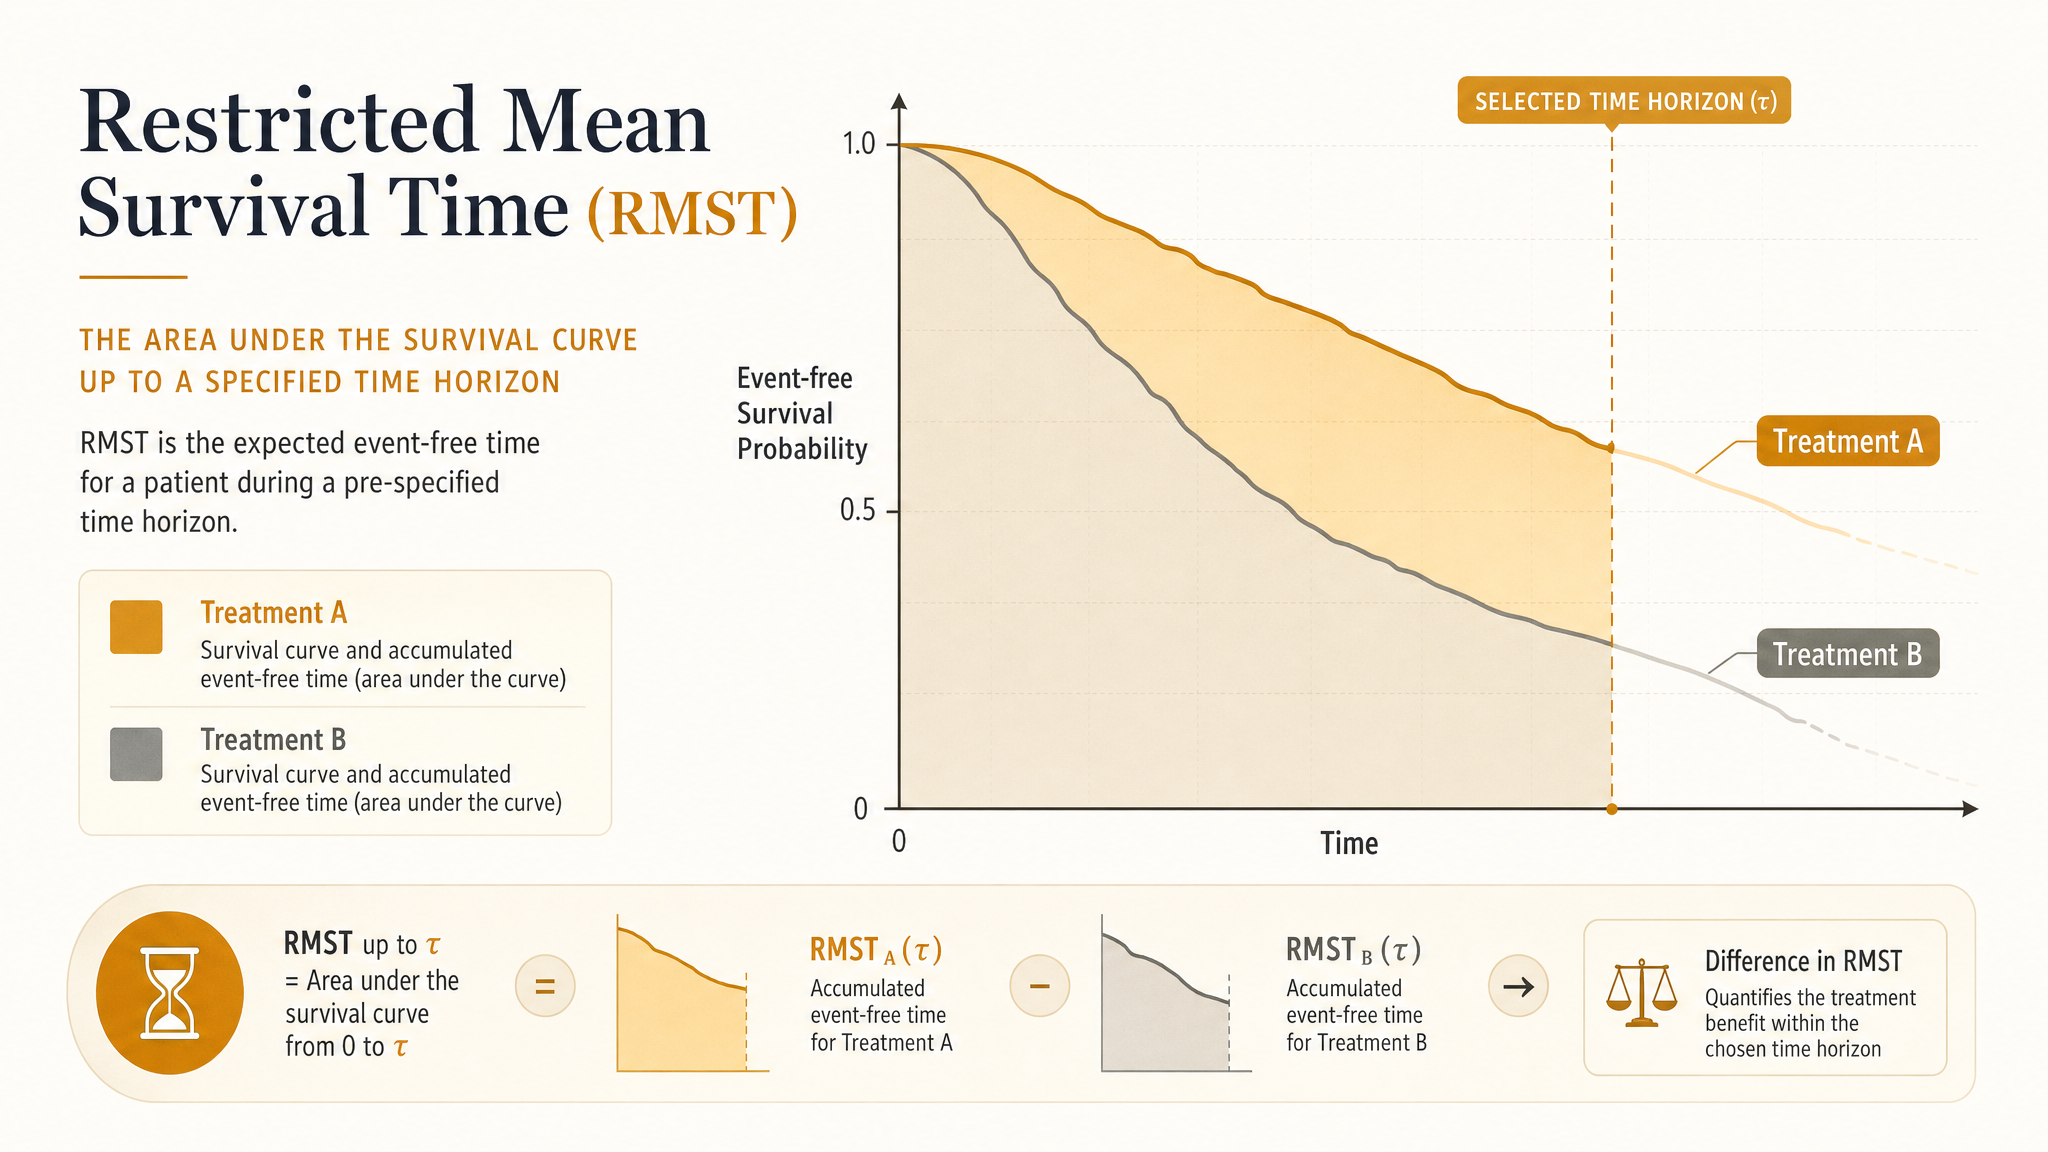
Pick a follow-up horizon, say 12 months or 3 years. The RMST for a group is the area under its survival curve from time zero to that horizon. In plain English: how much event-free time does the average patient accumulate over that window?
Clinical translation:
“Patients on treatment A stayed alive and out of the event state for an average of 10.8 months over the first year, versus 9.9 months on treatment B.”
The difference in RMST is the average gain or loss in event-free time over that period. No interpretive gymnastics about “instantaneous risk.” No pretending everyone hears “hazard ratio 0.82” and pictures the same thing.
Why People Are Getting Tired of Hazard Ratios
Hazard ratios are not evil. They are just overused. The usual Cox model summarizes a ratio of hazards, not a ratio of risks and not a difference in survival time. When hazards are roughly proportional, the summary can be useful. When they are not, the estimate becomes a sort of weighted average of changing effects over time, which is mathematically respectable and communicatively awful.
What the hazard ratio needs
Stable interpretation usually leans on proportional hazards or at least on the analyst being honest when that assumption is shaky.
What RMST needs
A prespecified time horizon and enough follow-up quality to estimate survival reasonably up to that point.
If your curves cross, diverge late, or separate early and then flatten, RMST often tells the clinical story with much less drama and much more honesty.
A Fast Example
Imagine a trial comparing two oncology regimens over 24 months. Early toxicity makes the new regimen look rough in the first few months, but later disease control improves. The Kaplan-Meier curves cross around month 6.
A single hazard ratio from a Cox model can become annoyingly opaque here. Is the new treatment better? Worse? “It depends on which slice of time you are standing in” is not a satisfying abstract.
RMST lets you say something far more concrete: over 24 months, patients on the new regimen gained an average of 1.7 additional months without progression. That is a quantity clinicians, patients, and reimbursement committees can all understand before coffee.
Interactive RMST explorer
Change the horizon. Watch the estimand change.
RMST is the area under the survival curve up to the selected horizon. The shaded region is the average event-free time gained or lost by treatment in this simulated example.
The treatment looks similar early, then separates later. A late horizon tells a different story than an early one.
When RMST Is Especially Useful
1. Non-proportional hazards
Crossing curves, delayed effects, waning effects, and early harm with later benefit all make a single hazard ratio harder to defend and harder to explain.
2. Pragmatic clinical communication
“Average event-free time gained by 1 year” lands much better than “the hazard was reduced by 18 percent,” especially when people quietly mistake that for risk reduction.
3. Trial and observational analyses with fixed decision windows
If the decision context is inherently time-bounded — 30-day readmission, 1-year survival, 5-year recurrence-free survival — RMST fits the question naturally.
4. Supplementing, not necessarily replacing, standard outputs
RMST can live happily alongside Kaplan-Meier curves, cumulative incidence plots, and even Cox models when those still serve a purpose.
The Most Important Design Choice: Pick the Horizon Before the Results Seduce You
RMST is only “restricted” because it stops at a chosen time horizon, usually written as tau. That choice matters. Change the horizon, and you can change the result.
Do not shop for tau.
Picking the horizon after staring at the curves is just outcome-driven flexibility in a lab coat.
Good horizon choices usually come from one of three places: a clinically meaningful follow-up window, the planned study duration, or the last time point with adequate support and acceptable censoring behavior across groups.
- Use 30 days if the decision is acute and short-term.
- Use 1 year if that is the main policy or clinical benchmark.
- Use the largest common follow-up horizon with credible estimation if censoring gets ugly later on.
RMST Versus the Hazard Ratio
| Feature | Hazard ratio | RMST difference |
|---|---|---|
| Interpretation | Relative hazard over time | Average event-free time gained or lost up to tau |
| Assumption sensitivity | Interpretation degrades when hazards are not proportional | Needs a sensible horizon and adequate follow-up to that horizon |
| Audience friendliness | Often misunderstood as a risk ratio | Usually intuitive to clinicians and patients |
| Best use case | When proportional hazards is plausible and the ratio is substantively meaningful | When time gained over a fixed window is the better question |
How to Read an RMST Result
Suppose the RMST by 12 months is 10.6 months in the treatment group and 9.8 months in the control group. The RMST difference is 0.8 months, or about 24 extra event-free days over the first year.
That result is not saying every patient lived exactly 24 extra days. It says the group-level average accumulated that much more event-free time across the chosen horizon.
Common Mistakes
Choosing tau because it looks favorable
If the horizon appears after the results, reviewers should assume the method was steering instead of measuring.
Using RMST where follow-up support is thin
If very few patients remain under reliable observation near the horizon, the estimate gets fragile fast.
Treating it as assumption-free magic
RMST avoids the proportional hazards trap, but censoring, confounding, selection, and measurement problems still exist. Statistics did not become a spa day.
Reporting only a p-value
The whole point is interpretable magnitude. Give the difference, units, confidence interval, and the horizon used.
Where RMST Fits in Observational Research
RMST is an outcome summary, not a confounding cure. In observational studies, you still need a defensible design: aligned time zero, clear eligibility, exposure definitions that do not leak future information, and a credible strategy for confounding control.
But once those basics are in place, RMST can be an excellent way to present treatment effects. In many comparative effectiveness settings, “average recurrence-free time gained by 2 years” is more decision-ready than a hazard ratio that hides changing effects over follow-up.
What Good Reporting Looks Like
- State the horizon and why it was chosen.
- Report RMST in each group and the between-group difference.
- Present confidence intervals in the same time units.
- Show the survival curves so readers can see the shape behind the summary.
- Say whether the analysis was primary, secondary, or sensitivity-focused.
- If a Cox model is also reported, explain why both summaries were useful rather than dumping both into the paper like statistical souvenir mugs.
Reviewer Red Flags
- No rationale for the chosen horizon.
- RMST reported only after proportional hazards clearly failed, with no sign it was prespecified.
- Late-horizon estimates despite heavy censoring and vanishing risk sets.
- Language implying RMST fixed confounding or selection bias in an observational study.
- Interpretations that slide from “time gained over 1 year” into “lifetime benefit” without evidence.
The Practical Bottom Line
Restricted mean survival time is not fashionable garnish. It is often the more honest estimand.
If your real question is how much event-free time patients gain over a clinically meaningful window, RMST answers it directly. If your curves misbehave, your hazards are not proportional, or your audience deserves plain language instead of ritual jargon, RMST is usually a very good move.
Use it with a prespecified horizon, show the curves, report the actual time difference, and resist the urge to make one summary statistic carry more meaning than the design can support. Survival analysis is hard enough without pretending the hazard ratio is the only respectable accent in the room.
Keep reading
Don't stop at one method.
Good methods judgment comes from contrast. Read the neighboring guides, see where the assumptions diverge, and avoid treating every observational problem like it needs the same hammer.
Landmark Analysis: Useful, Honest, and Frequently Overclaimed
A practical guide to landmark analysis for clinical researchers. Covers delayed treatment, immortal time bias, conditional survivor populations, landmark selection, and why a cleaner timeline still changes the causal question.
Informative Censoring: When Dropout Is Part of the Bias
A practical guide to informative censoring for clinical researchers. Covers loss to follow-up, treatment discontinuation, database exit, inverse probability of censoring weights, and why dropout can bias survival and causal estimates when it depends on prognosis.
Competing Risks: When Kaplan-Meier Tells the Wrong Clinical Story
A practical guide to competing risks for clinical researchers. Covers death and discharge as competing events, why Kaplan-Meier can overstate event probability, and how cause-specific hazards and cumulative incidence answer different clinical questions.