Tipping-Point Analysis for Missing Outcomes: How Far Must the Assumption Move?
Anas H. Alzahrani, MD PhD MPH
Department of Preventive Medicine and Public Health
Faculty of Medicine, King Abdulaziz University
A randomized trial reports a favorable treatment effect, but some participants have no final outcome. The primary model assumes that, after conditioning on observed information, those missing values behave like values we did observe. What if participants with missing outcomes would have done worse?
A tipping-point analysis does not guess the missing outcomes. It asks a more transparent question: how unfavorable would they need to be before the trial's conclusion changes, and is that departure clinically plausible?
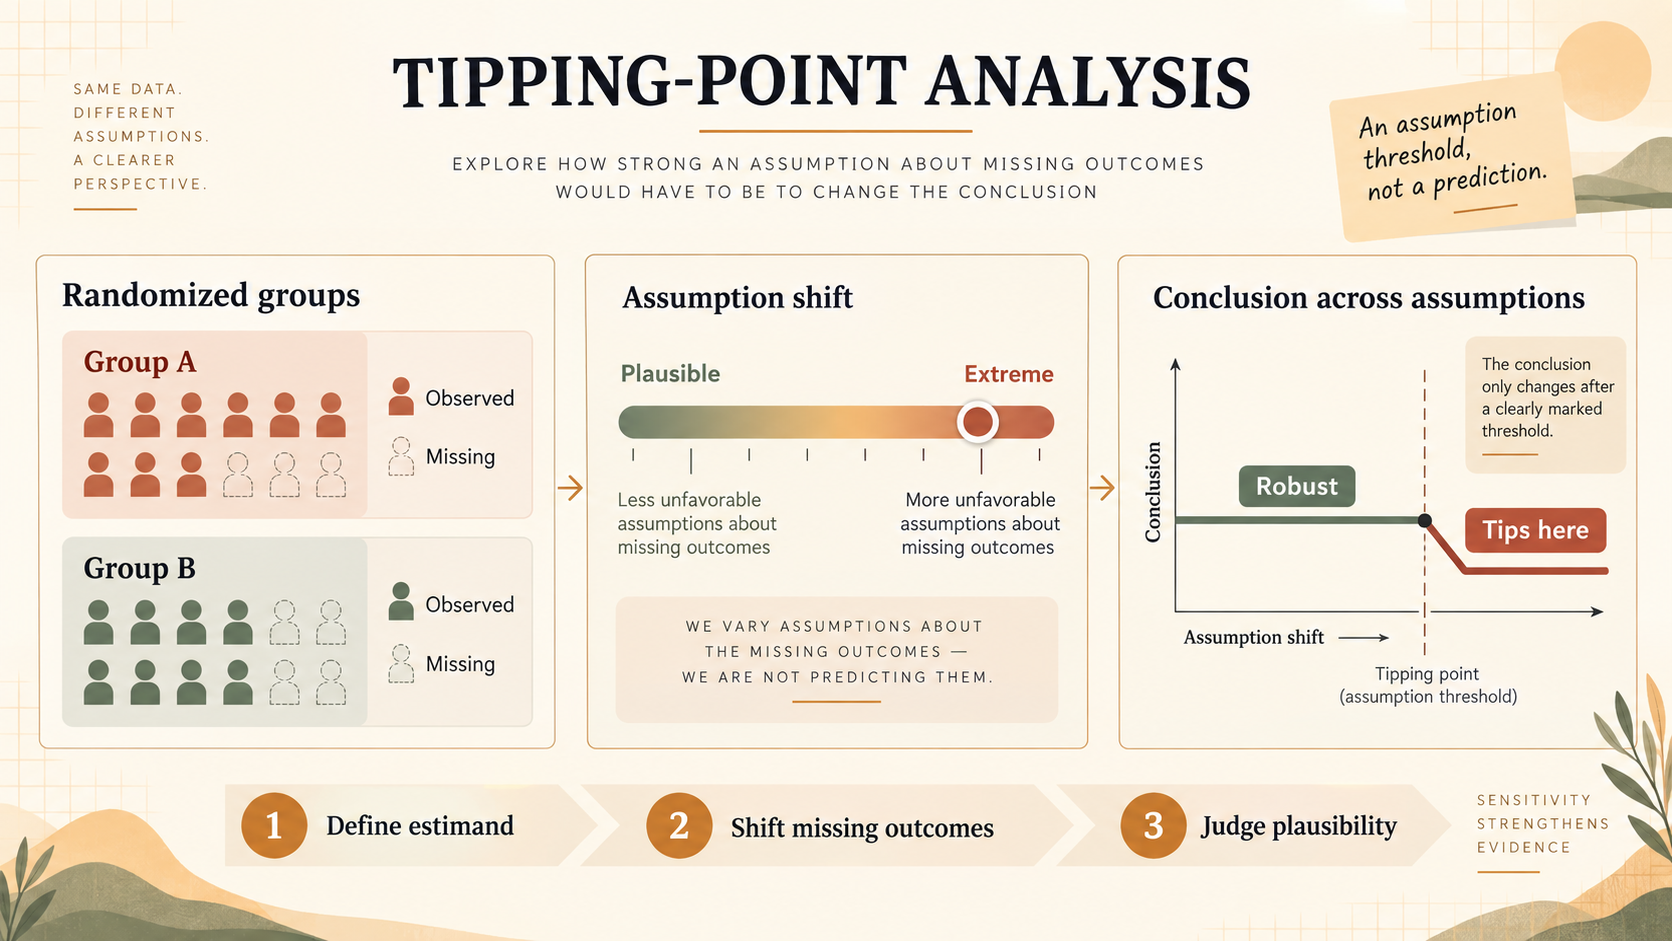
The Method in One Sentence
Hold the scientific question fixed, vary one or more explicit assumptions about the outcomes that were not observed, repeat the analysis across those assumptions, and identify where the conclusion changes.
Concrete takeaway
The tipping point is not proof that the primary assumption was correct. It is a map of how much the unverifiable assumption must move before the inference changes.
Start With the Estimand, Not the Software
Missing data and intercurrent events are related but not interchangeable. Treatment discontinuation, rescue medication, or death can change what outcome is scientifically relevant; failure to observe that relevant outcome creates a missing-data problem. ICH E9(R1) therefore places the treatment-effect question first and requires sensitivity analyses to target the same estimand as the main analysis.
Suppose the estimand is the difference in mean symptom score at week 24 under a treatment-policy strategy. Participants remain part of that question after discontinuation, so collecting their week-24 outcomes is valuable. If those outcomes are missing, a sensitivity analysis should stress-test assumptions about those same treatment-policy outcomes—not silently switch to a hypothetical world in which discontinuation never occurred.
What Actually Moves?
For a continuous outcome, a delta-adjusted pattern-mixture analysis can shift the imputed values for participants with missing outcomes by a specified amount relative to the missing-at-random model. The analyst repeats the calculation over a grid of deltas. A reference-based analysis instead links the unobserved post-discontinuation trajectory in one group to observed behavior in another group, such as “jump to reference.” Each method encodes a clinical story, not merely a computational preference.
| Analysis | Question it explores | What must be justified |
|---|---|---|
| Delta adjustment | What if missing outcomes differ from model predictions by a specified amount? | Direction, scale, range, and whether deltas differ by group or reason |
| Reference based | What if post-event outcomes follow a trajectory borrowed from another group? | Why that reference trajectory matches the clinical event |
| Binary best/worst cases | What outcome rates among missing participants would overturn the conclusion? | Feasible rates and arm-specific clinical plausibility |
Worked Example: A Result That Tips Too Easily
Imagine 300 participants per group and a lower-is-better symptom score. The primary analysis estimates a treatment difference of −3.0 points. Final outcomes are missing for 8% of the comparator group and 20% of the treatment group, often after adverse effects or perceived lack of benefit.
The sensitivity grid progressively worsens the unobserved treatment-group outcomes relative to their model predictions. The statistical conclusion changes at a delta of +1.2 points. That threshold is not self-interpreting. Clinicians should compare it with the outcome scale, earlier measurements, discontinuation reasons, observed trajectories among similar participants, and the magnitude considered clinically important.
If a 1.2-point deterioration is entirely plausible, the conclusion is fragile. If overturning the result requires nearly every missing treatment outcome to be dramatically worse than comparable observed outcomes, the finding is more robust. Either way, report the full map rather than only the most reassuring cell.
Three Common Misreadings
“It did not tip”
Only supports robustness over the assumptions that were actually explored.
“The tipping value is true”
The value is a threshold for interpretation, not an estimate of unseen outcomes.
“Any sensitivity analysis is enough”
Arbitrary scenarios can miss plausible departures or answer a different estimand.
The 90-Second Tipping-Point Audit
- What estimand does the primary analysis target?
- Why are outcomes missing, and does the reason differ by treatment group?
- Which unverifiable assumption is varied in the tipping-point analysis?
- Are both treatment groups shifted, or only one?
- At what assumption does the clinical or statistical conclusion change?
- Is that assumption clinically plausible, and who made that judgment?
What Reviewers Should Demand
Ask for missingness by treatment group, visit, discontinuation status, and reason. Require a primary analysis whose assumptions are stated in clinical language, then a sensitivity analysis that systematically explores credible departures while preserving the estimand. The tipping region should be displayed, not hidden behind a sentence that results were “consistent.”
Plausibility should be judged before the team knows which scenario rescues the preferred conclusion. Document who supplied the clinical bounds and what evidence informed them. Prevention still comes first: follow participants after treatment discontinuation when the estimand requires those outcomes, and do not treat sophisticated imputation as a replacement for follow-up.
Sources and Evidence Maturity
- ICH E9(R1), Addendum on Estimands and Sensitivity Analysis in Clinical Trials (adopted 20 November 2019) — Step 4 harmonized guideline; mature regulatory framework for estimand-aligned main and sensitivity analyses.
- EMA, Guideline on Missing Data in Confirmatory Clinical Trials (20 September 2010; effective 1 January 2011) — adopted regulatory guideline; primary source for prevention, analysis, sensitivity, and reporting expectations.
- Torres et al., A Tipping Point Method to Evaluate Sensitivity to Potential Violations in Missing Data Assumptions (2025) — peer-reviewed FDA-authored methods paper; direct framework for systematic arm-specific tipping-point exploration.
- Cro et al., Sensitivity Analysis for Clinical Trials With Missing Continuous Outcome Data Using Controlled Multiple Imputation (20 September 2020) — peer-reviewed practical methods guide; established implementation framework for delta-based and reference-based controlled multiple imputation.
Evidence note: this guide interprets mature regulatory guidance and peer-reviewed methods literature. The numerical example is hypothetical and does not make a treatment-effect or regulatory claim.
Where Aqrab Fits
Aqrab can help reviewers align the protocol, estimand, discontinuation reasons, missingness table, primary assumptions, and sensitivity scenarios. Use the result as a structured audit trail—not a substitute for the statistician or clinical judgment about plausible missing outcomes. Try Aqrab on a trial report, or explore plans for repeatable evidence-review workflows.
Keep reading
Don't stop at one method.
Good methods judgment comes from contrast. Read the neighboring guides, see where the assumptions diverge, and avoid treating every observational problem like it needs the same hammer.
Complete-Case Analysis: When Missing Data Quietly Changes the Study Population
A practical guide to complete-case analysis for clinical researchers. Covers when dropping incomplete records changes the study population, how endpoint missingness becomes selection bias, and what reviewers should demand before trusting the estimate.
Jump-to-Reference Imputation: When Missing Outcomes Start Borrowing the Control Arm's Future
A practical guide to jump-to-reference imputation for clinical researchers. Covers what J2R assumes after treatment discontinuation, when it helps sensitivity analysis, and when it quietly answers the wrong estimand.
Last Observation Carried Forward: When Yesterday's Outcome Pretends the Patient Stopped Changing
A practical guide to last observation carried forward for clinical researchers. Covers why LOCF fails as missing-data strategy, how it can exaggerate or dilute treatment effects, and what reviewers should demand instead.
This is the newest guide so far.