Interrupted Time Series: Strong Quasi-Experiments Need More Than a Before-and-After Plot
Interrupted time series is one of the most abused designs in applied health research. People implement a policy, draw a line at the intervention date, notice the trend looks different afterward, and start talking like they ran a trial. That is not how this works. Interrupted time series can support strong causal claims, but only when the design and modeling take time seriously, rule out obvious alternative explanations, and separate immediate level changes from longer-term slope changes.
My take is simple. A good ITS paper is not a prettier before-and-after study. It is a structured quasi-experiment built on dense longitudinal data, a credible intervention time, stable measurement, and honest confrontation with seasonality, co-interventions, anticipation, and autocorrelation. If those pieces are weak, segmented regression just gives you more elegant nonsense.
What Interrupted Time Series Actually Estimates
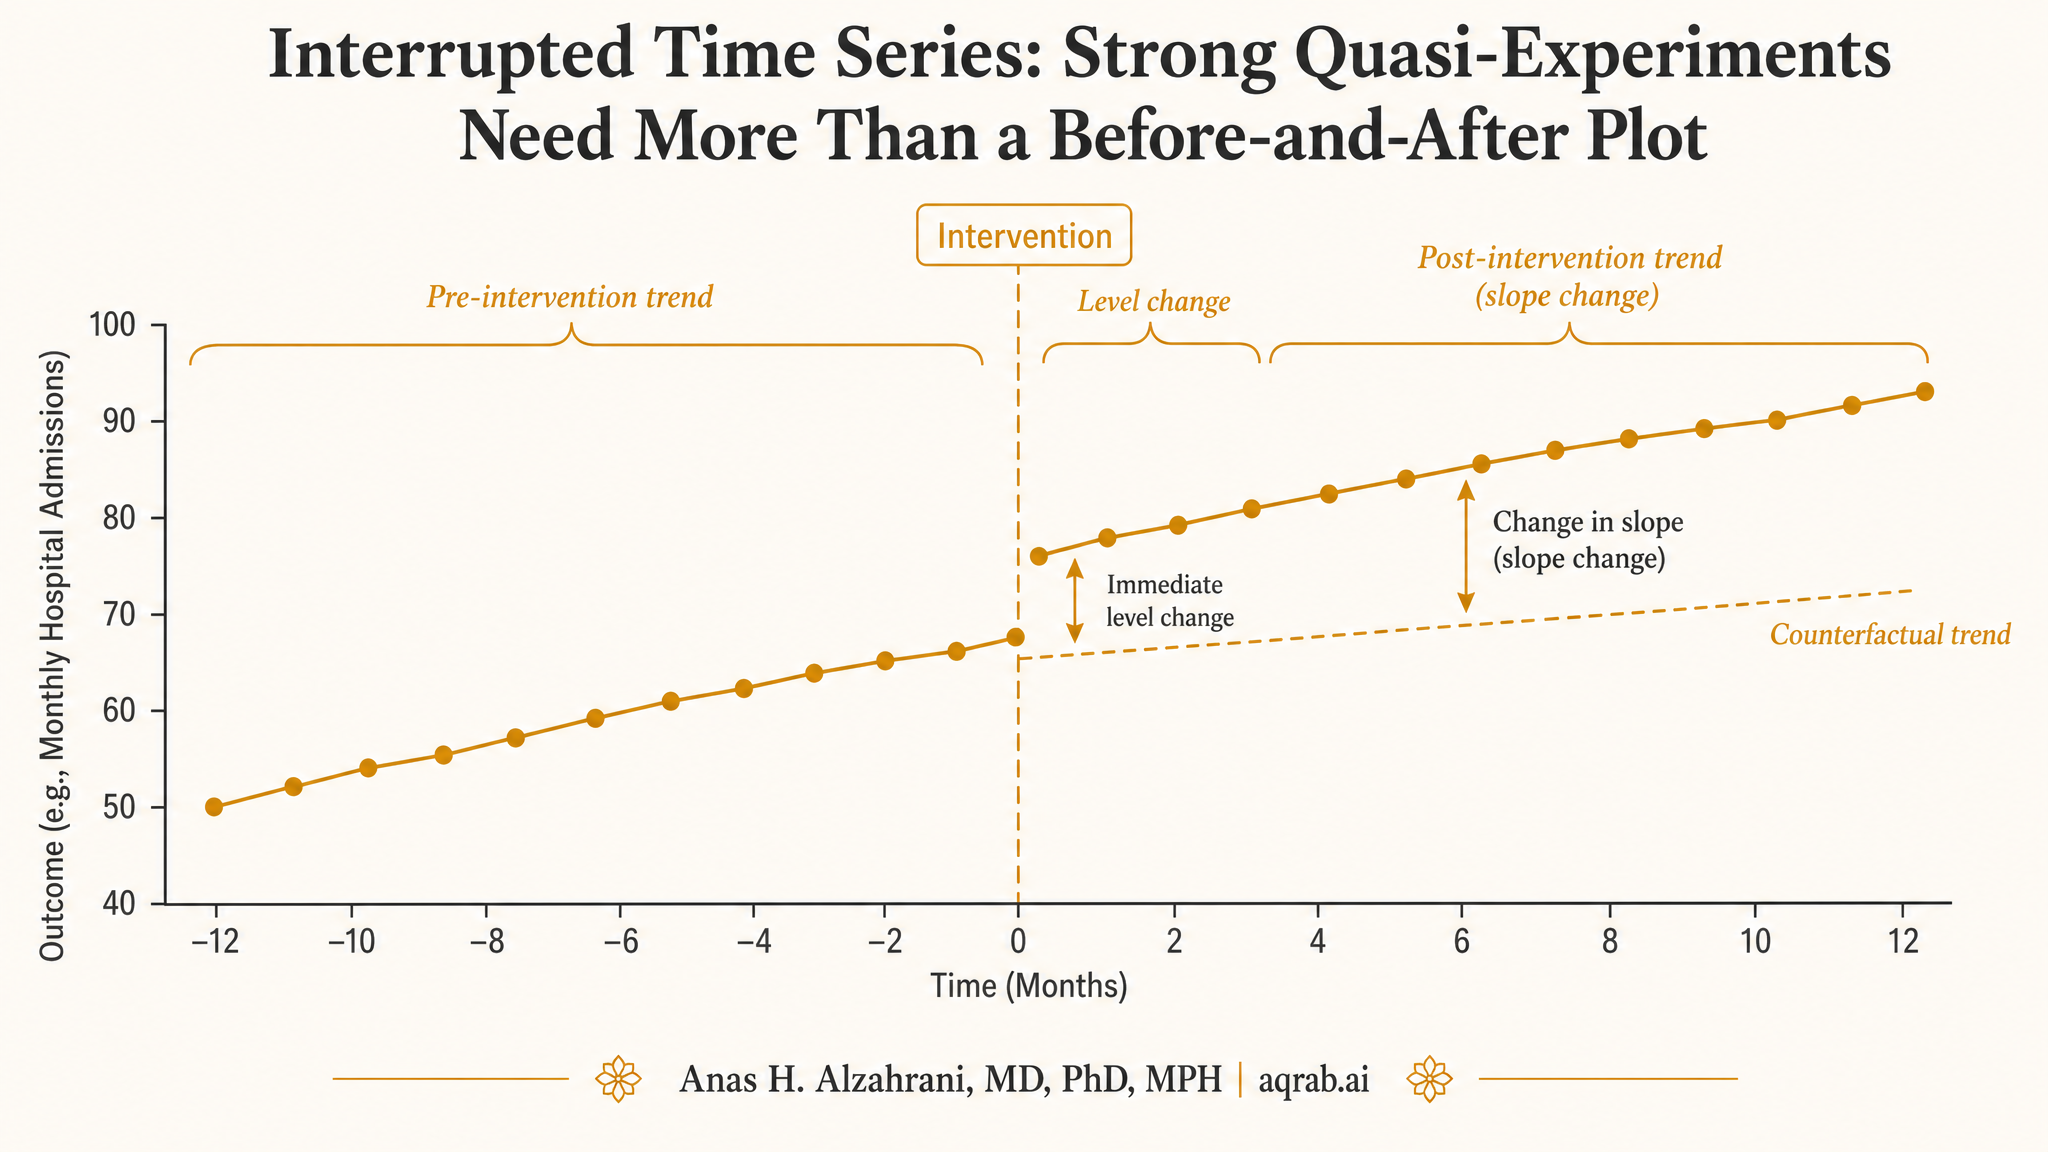
ITS asks whether the observed outcome trajectory changed when an intervention, policy, shock, or implementation event occurred. The change can appear in two main ways:
Level change
An immediate jump or drop right after the interruption. Example: antibiotic prescribing falls abruptly after a stewardship rule goes live.
Slope change
A change in the rate of increase or decrease after the interruption. Example: mortality keeps falling, but now it falls faster.
Good ITS work usually estimates both, because interventions can cause an immediate shift, a gradual shift, or both. If a paper only says “post period was lower than pre period,” it is leaving the most important structure on the floor.
Why Plain Before-and-After Comparisons Are Weak
Suppose a hospital launches a sepsis bundle in January and 30-day mortality declines afterward. Great. But would mortality have been declining anyway? Was there a simultaneous staffing change, a new EHR alert, case-mix drift, seasonal pathogen variation, or a broader secular improvement across hospitals? A simple pre/post comparison cannot tell you.
The weak move:
Collapsing months of longitudinal information into two averages and pretending the difference is the intervention effect.
ITS is stronger because it uses the pre-intervention trend as part of the counterfactual. That does not make it bulletproof, but it is vastly better than throwing away time.
The Basic Segmented Regression Logic
The standard ITS model includes time, an indicator for the post-intervention period, and an interaction between time and the post-intervention period. In plain English, you estimate:
- the baseline trend before the intervention,
- the immediate step change at the interruption, and
- the difference in trend after the interruption.
That is the conceptual model. The real work is in making sure the error structure, timing assumptions, and competing explanations are not garbage.
A Clinical Example: Antibiotic Stewardship Policy
Imagine monthly broad-spectrum antibiotic prescribing rates across 48 months in a health system. At month 25, a stewardship policy requires infectious disease approval for selected agents. A credible ITS analysis would ask:
- Did prescribing drop immediately after policy activation?
- Did the monthly trend change afterward?
- Was there evidence that prescribing was already dropping before the policy?
- Did anything else happen around month 25 that could explain the break?
If you have enough time points, stable outcome definition, and no obvious coincident intervention, ITS can be excellent here. If the policy rolled out gradually across sites, was announced months early, and changed documentation rules at the same time, your “interruption” is already fuzzy.
What Makes ITS Credible
A clearly defined interruption
The intervention date must mean something operationally. “Sometime in Q2” is not a serious interruption point.
Enough pre and post time points
Two points before and two after is not a time series. You need enough data to estimate trend, seasonality, and noise structure with a straight face.
Stable measurement
If coding, case definitions, denominator construction, or surveillance effort changed at the same time, you may be modeling an artifact.
Plausible absence of other shocks
ITS assumes no other event around the same date explains the break. That assumption deserves argument, not silence.
The Assumptions People Forget
ITS does not require parallel trends like DID, but it absolutely requires assumptions. The most important are usually ignored because they are less famous.
No concurrent intervention that explains the break
If a reimbursement rule, staffing overhaul, media event, or formulary change lands at the same time, attribution gets ugly fast.
Correct functional form for time
Linear time is convenient, not sacred. If the outcome was curving already, a straight-line counterfactual may be fiction.
Autocorrelation is handled properly
Serially correlated outcomes make naive standard errors look cleaner than they deserve. Fancy p-values from the wrong error model are still wrong.
Seasonality and periodicity are modeled
Respiratory admissions, antibiotic use, ED flow, and many other outcomes have calendar patterns. Ignore them and you may “discover” winter.
Single-Series ITS vs Controlled ITS
A single interrupted series can be useful, but adding a comparison series usually makes the design much stronger. A controlled ITS asks whether the break in the intervention series differs from what happened in a comparable untreated series over the same period.
| Design | Strength | Main weakness |
|---|---|---|
| Single-series ITS | Uses pre-trend to form a structured counterfactual | Vulnerable to coincident shocks and system-wide secular changes |
| Controlled ITS | Improves control for background changes happening at the same time | Needs a genuinely comparable control series, which is harder than it sounds |
My bias: if a sensible control series exists, use it. Not because single-series ITS is invalid, but because reviewers should not have to trust your historical counterfactual more than necessary.
Where Researchers Usually Screw This Up
- They pick the intervention date after seeing the data.
- They ignore anticipation effects even though the policy was announced months earlier.
- They treat a gradual rollout like a sharp interruption.
- They omit seasonality in strongly seasonal outcomes.
- They never assess whether residuals are autocorrelated.
- They change coding definitions at the intervention point and call the resulting jump causal.
- They report only p-values instead of absolute changes, trend changes, and visual diagnostics.
Classic fraud-by-figure:
A line chart with a vertical intervention marker, no uncertainty bands, no seasonality adjustment, no control series, and a triumphant conclusion.
What Good Reporting Looks Like
At minimum, a serious ITS paper should report:
- the exact intervention timing and whether rollout was sharp or gradual,
- the number and spacing of pre and post observations,
- the outcome and denominator definitions, including any changes over time,
- the modeled pre-trend, level change, and slope change,
- how seasonality, autocorrelation, and nonlinearity were handled,
- what other events occurred near the interruption date,
- visual plots with observed and fitted values, not just coefficients,
- sensitivity analyses for alternative interruption dates or lag structures.
If a paper claims ITS and skips half of that, the design is being used as branding rather than evidence.
When ITS Is a Strong Choice
- Policy or system interventions where randomization is impossible.
- Repeated routine data like monthly prescribing, admissions, infection rates, or screening uptake.
- Well-defined implementation dates with little ambiguity about when the change started.
- Settings with enough longitudinal depth to estimate underlying trend and seasonality.
- Questions focused on population-level change rather than individual treatment effects.
When It Is the Wrong Tool
ITS is weak when the intervention date is fuzzy, the outcome definition changed at the same time, the series is too short, or the environment was hit by multiple overlapping changes. It is also the wrong tool when your real question is about patient-level treatment effects rather than system-level trajectory shifts.
And no, slapping Newey-West standard errors on a flimsy pre/post comparison does not suddenly make it an interrupted time series study.
The Bottom Line
Interrupted time series is one of the best quasi-experimental designs in the real world, especially for policies, implementation changes, and health-system interventions. But it earns that status only when time is modeled carefully and alternative explanations are taken seriously.
The honest question is not “did the line move after the intervention?” It is “would a comparable trajectory likely have continued differently if the intervention had not happened?” That is a much harder question, and that is exactly why ITS can be powerful when done well.
My blunt version: if your ITS design does not make me believe the interruption matters more than the calendar, the method did not fail. The study design did.
Keep reading
Don't stop at one method.
Good methods judgment comes from contrast. Read the neighboring guides, see where the assumptions diverge, and avoid treating every observational problem like it needs the same hammer.
Stochastic Interventions: When “Treat Everyone” Is Not the Policy Question
A practical guide to stochastic interventions for clinical researchers. Covers when deterministic treatment rules become unrealistic, how probability-shift interventions preserve positivity, and what reviewers should demand before trusting policy-effect claims.
Synthetic Control Methods: Building Counterfactuals When DID Fails
How to construct a synthetic twin from donor pools when parallel trends don't hold. Covers SCM optimization, validation via placebo tests, modern extensions (ASCM, SDID), and common pitfalls.
Difference-in-Differences: A Practical Guide for Clinical Researchers
When and how to use DID in clinical research. Covers parallel trends, staggered adoption, common pitfalls, reporting checklist, and modern estimators.