Positivity & Overlap: The Assumption Your Causal Estimate Cannot Survive Without
Researchers love saying they adjusted for confounding. Much fewer ask whether the data ever gave them a fair comparison in the first place. Positivity, sometimes called overlap or common support, is the assumption that for every relevant covariate pattern, patients had a real chance of receiving each treatment strategy being compared. If that is false, causal estimation stops being hard and starts being fiction.
This is the ugly secret behind many beautiful-looking propensity score analyses. The model converges, the balance table looks improved, the weights get computed, and the estimate still rests on a handful of patients being asked to represent an entire clinical region where the counterfactual was never plausibly observed.
The Core Idea
Positivity means that within levels of the covariates you are conditioning on, treatment assignment is not deterministic.
Formal intuition
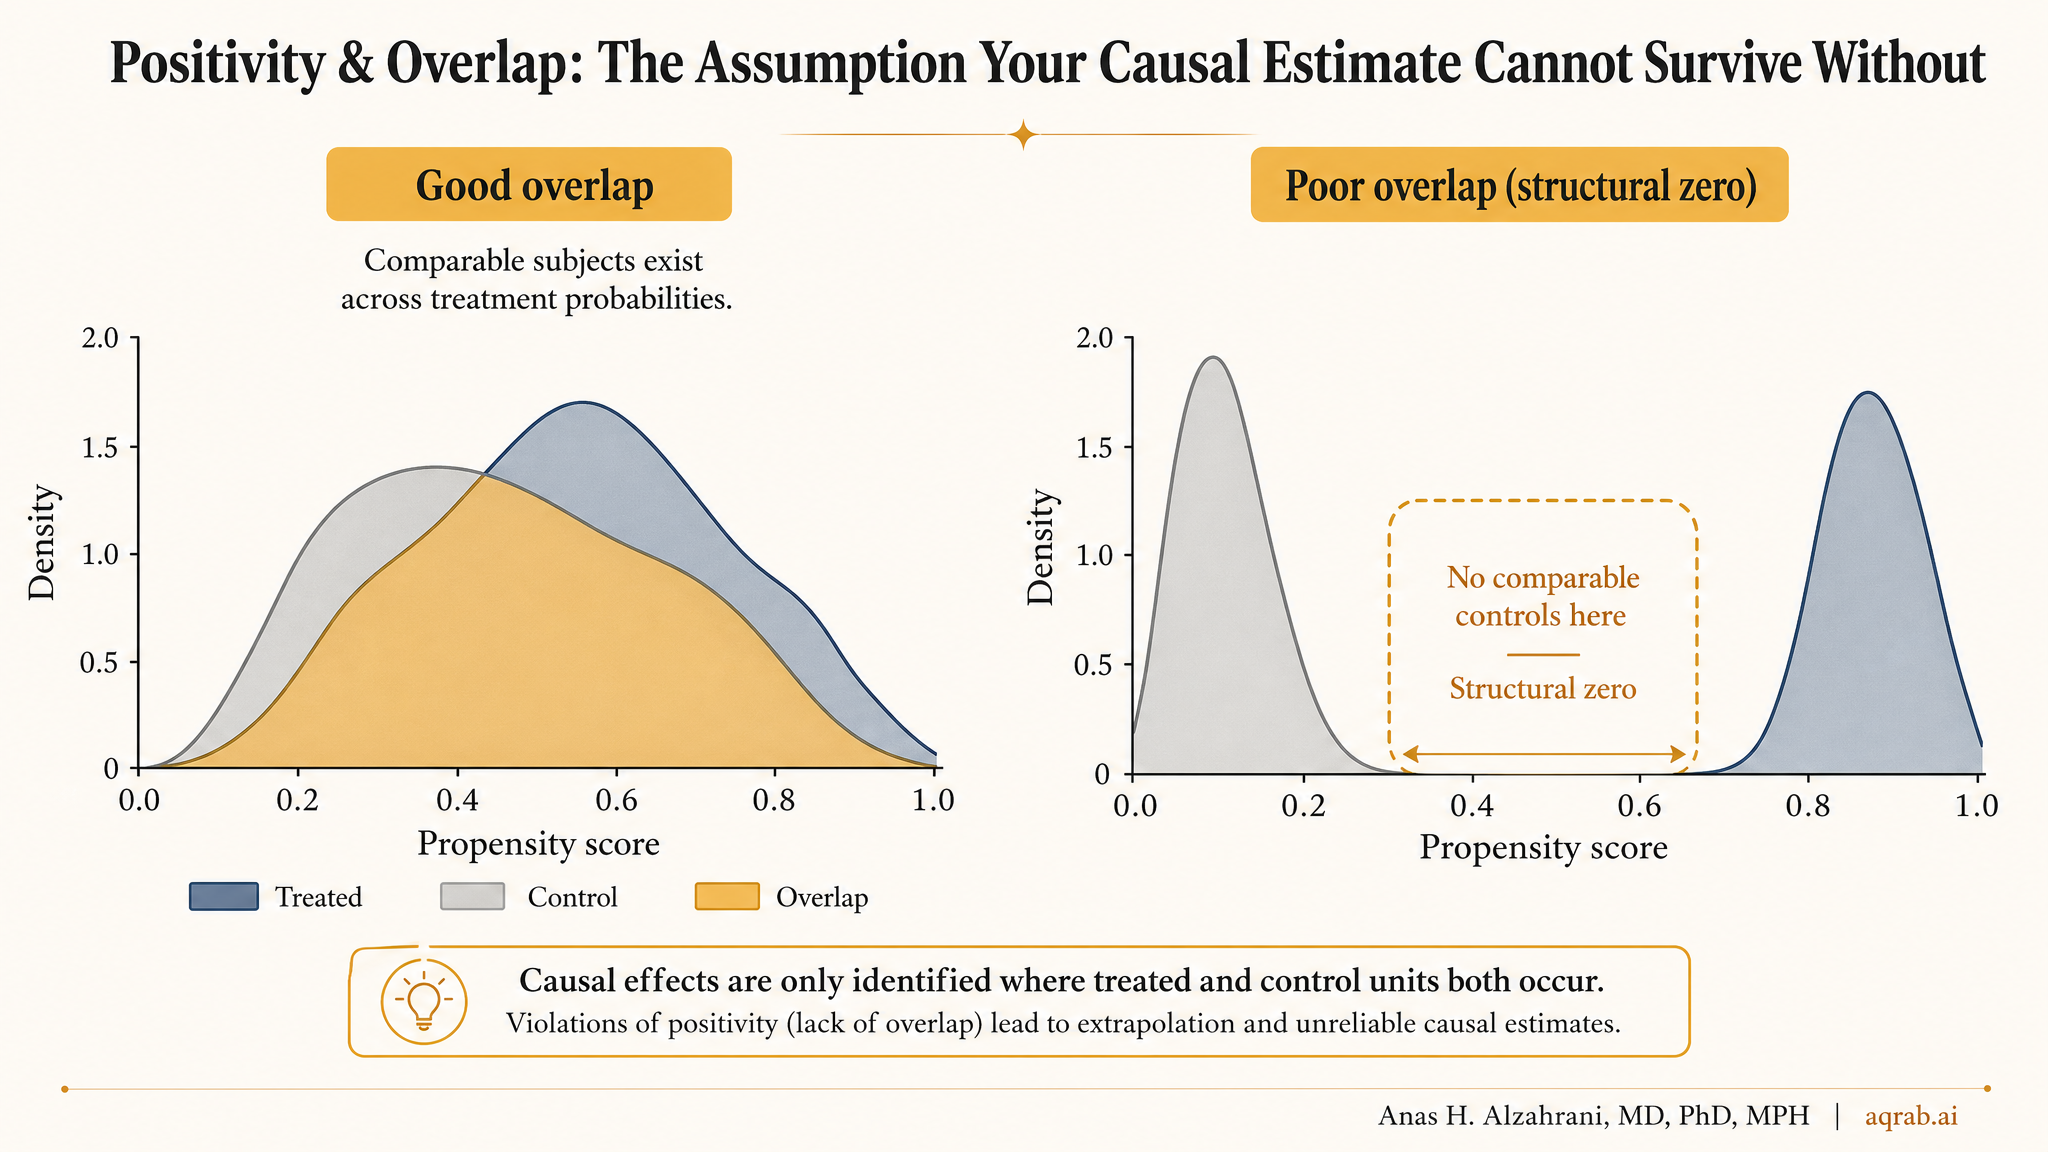
For every covariate pattern X with nonzero probability, the probability of treatment must satisfy 0 < P(A = 1 | X) < 1. In plain English, comparable patients must exist in both treatment groups.
If frail elderly patients almost always receive treatment and healthier younger patients almost never do, then the data may contain little or no support for comparing those treatment strategies within the covariate strata that matter.
Positivity vs Exchangeability
These assumptions travel together but they are not the same thing.
Exchangeability
No uncontrolled confounding after conditioning on measured covariates.
Question: are treated and untreated patients comparable in principle?
Positivity
Both treatment options actually occur across the covariate space.
Question: does the dataset contain the comparisons your analysis claims to make?
You can measure confounders perfectly and still fail positivity. If one treatment is essentially reserved for a narrow patient type, no amount of regression theology rescues the missing counterfactual support.
What Overlap Failure Looks Like in Practice
Propensity scores pile up near 0 or 1
When almost everyone in a region of covariate space receives the same treatment, estimated treatment probabilities become extreme.
Inverse probability weights explode
A few patients get enormous weight because they are standing in for a counterfactual population the study barely observed.
Matching discards half the cohort
If good matches barely exist, the design starts amputating the data just to create a comparison that looks acceptable.
Estimates become sensitive to arbitrary trimming choices
When tiny design decisions swing the answer, the problem is often not robustness. It is poor common support.
A Clinical Example
Imagine comparing early ECMO versus standard care for severe respiratory failure using observational ICU data. The sickest patients are far more likely to receive ECMO, but some are too unstable to transfer and never receive it. Meanwhile the least severe patients rarely qualify. The two groups now occupy very different clinical worlds.
You can build a sophisticated propensity score model including age, PaO2/FiO2 ratio, vasopressor use, lactate, organ failure scores, and comorbidities. That does not guarantee overlap. If ECMO-treated patients still cluster in a region where almost no controls exist, your estimated effect relies on extrapolation wearing a causal badge.
Takeaway:
The model is not comparing like with like. It is asking the untreated patients to impersonate people they were never clinically close to being.
Why Weights Tell on You
Positivity failures often show up most clearly in weighting analyses. IPW and marginal structural models depend on the inverse of the treatment probability. So if a patient had a treatment probability near zero or one, their weight becomes huge.
What extreme weights usually mean
- Your data have weak common support.
- Your target estimand may be poorly identified in the observed sample.
- Your estimate is being driven by a small, unstable subset of patients.
- Your variance problem is a design problem, not just a computational problem.
Truncating or stabilizing weights can improve numerical behavior, but it does not magically restore information that the dataset never contained.
How to Diagnose Overlap Before You Pretend It Is Fine
- Plot propensity score distributions by treatment group.
- Inspect standardized mean differences before and after weighting or matching.
- Report the proportion of observations trimmed or unmatched.
- Summarize weight distributions, not just means, but tails and maxima.
- Check whether conclusions change across overlap-restricted samples.
If the overlap plot looks ugly, that is not a cosmetic issue. It is the analysis telling you your estimand may need to change.
What to Do When Positivity Is Weak
Redefine the target population
If overlap only exists in a clinically narrower subgroup, say that plainly and estimate the effect there instead of lying about the whole population.
Trim or restrict with justification
Overlap restriction can produce a more credible estimate, but it changes the estimand. That change should be explicit, not buried in supplementary methods.
Use overlap-focused estimands
Methods targeting the overlap population can be better aligned with the data than forcing an ATE no one honestly identified.
Admit when the design cannot answer the question
Sometimes the right move is not another sensitivity analysis. It is saying the comparison is too structurally confounded and unsupported to make causally.
Common Mistakes
Calling extreme weights a minor nuisance
They are often the loudest warning your causal question outran your data.
Reporting balance without reporting support
Good balance after aggressive weighting can still hide terrible overlap and unstable identification.
Ignoring that trimming changes the estimand
Once you drop the non-overlap region, you are no longer estimating the original population effect.
Letting the model extrapolate into clinical nonsense
Regression can produce numbers outside the region where actual treated and untreated patients meaningfully coexist. That is interpolation fantasy, not evidence.
What Reviewers Should Expect
- A clear estimand, including whether the target is the full population, the treated, the untreated, or an overlap-restricted population.
- Visual overlap diagnostics, not just a sentence claiming common support was adequate.
- Weight diagnostics, including truncation rules and tail behavior.
- Transparent reporting of discarded observations after matching, trimming, or restriction.
- Interpretive honesty when poor support limits causal scope.
The Bottom Line
Positivity is not a technical footnote. It is the assumption that your data contain the comparisons your causal question requires. When overlap fails, the analysis does not become slightly less efficient. It becomes structurally less believable.
If treated and untreated patients barely resemble each other, stop congratulating the model for producing an answer. First ask whether the data ever had the right to answer the question at all.
Keep reading
Don't stop at one method.
Good methods judgment comes from contrast. Read the neighboring guides, see where the assumptions diverge, and avoid treating every observational problem like it needs the same hammer.
Inverse Probability Weighting: When PSM Discards Your Data
Why IPW outperforms matching by keeping all patients — and how extreme weights, positivity violations, and wrong variance estimators break published analyses silently.
Treatment-Induced Mediator-Outcome Confounding: When Mediation Analysis Starts Chasing the Consequences of Treatment
A practical guide to treatment-induced mediator-outcome confounding for clinical researchers. Covers why natural direct and indirect effects fail when treatment changes later severity, toxicity, adherence, or surveillance that affect both the mediator and outcome.
Stochastic Interventions: When “Treat Everyone” Is Not the Policy Question
A practical guide to stochastic interventions for clinical researchers. Covers when deterministic treatment rules become unrealistic, how probability-shift interventions preserve positivity, and what reviewers should demand before trusting policy-effect claims.